The histogram is needed to assess the exposure and color rendition of the picture correctly. It looks like a graph of two perpendicular axes: the horizontal one shows the brightness, and the vertical one shows how the tones of this same brightness component are distributed. There is also a color histogram, which, accordingly, allows you to evaluate the color. This article will show you how to read histograms and apply them when working with photos.
What is A Histogram in Photography?
A histogram is a tool for technical quality control of a photo. Having mastered the skills of reading the schedule, you will be able to make adjustments to the exposure compensation right in the process of shooting.

You can find a histogram in any digital camera, as well as in photo editors. That can tell you how to correctly set the dynamic range to avoid overexposures or too deep shadows.
A photo editing program will help you adjust the exposure, focusing on the same graph.
How to Read Histogram of A Photo?
It’s effortless: the bar will crawl to the left if the frame is underexposed (too dark).
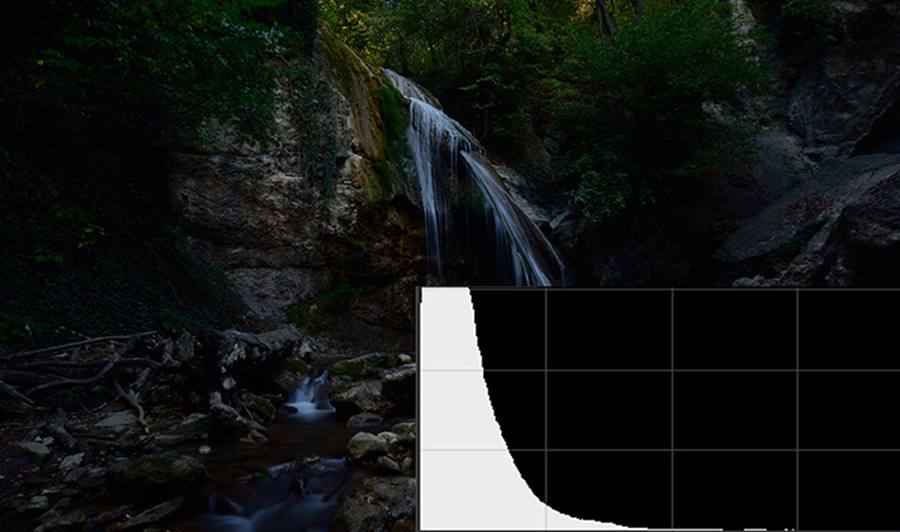
And if the photo is overexposed (i.e., overexposed) – to the right.
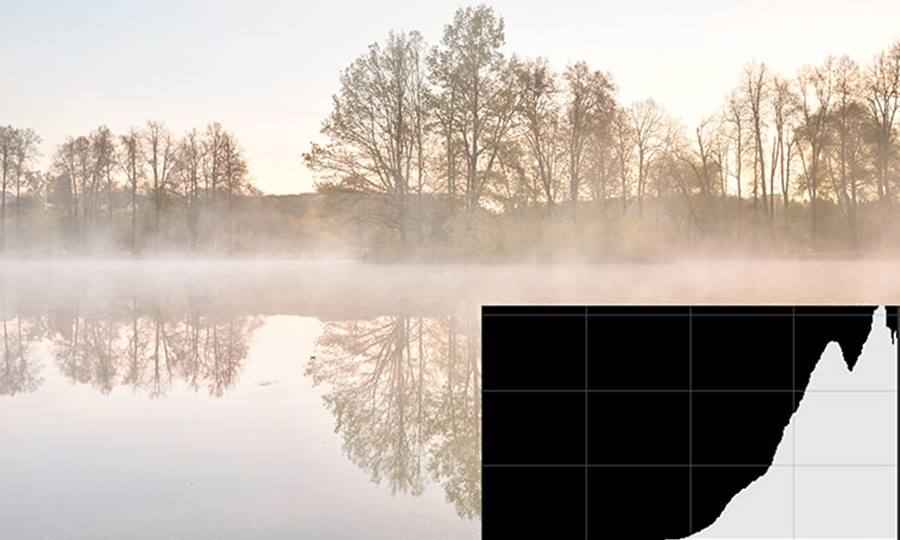
It is a hint to the photographer that he has lost detail in shadows or highlights. In this case, it will be possible to lighten the black areas in a graphics editor to return them to detail. The situation with white is more complicated since, in most cases, no details are preserved in them.
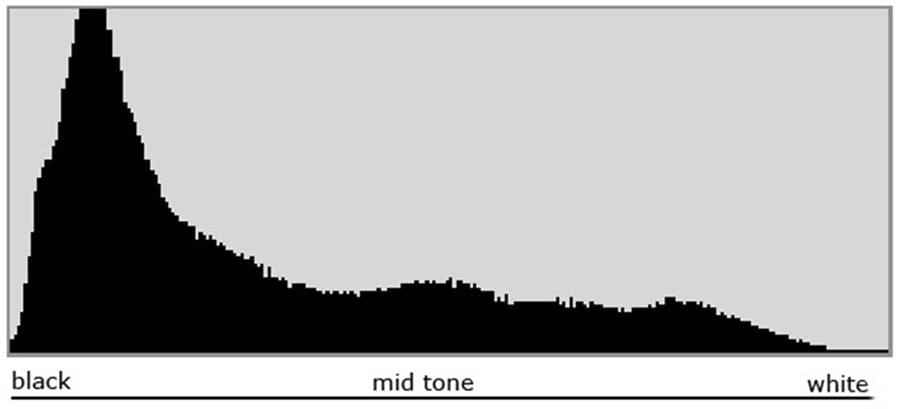
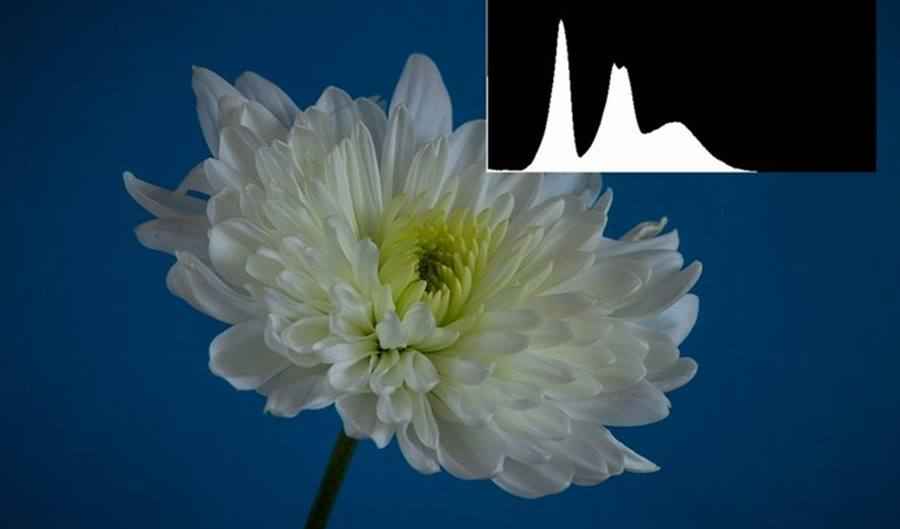
A correct histogram in photography looks like a gentle hill; when closer to the center, the number of mid-tones increases and the distribution of dark and light evenly and smoothly decreases near the edges.
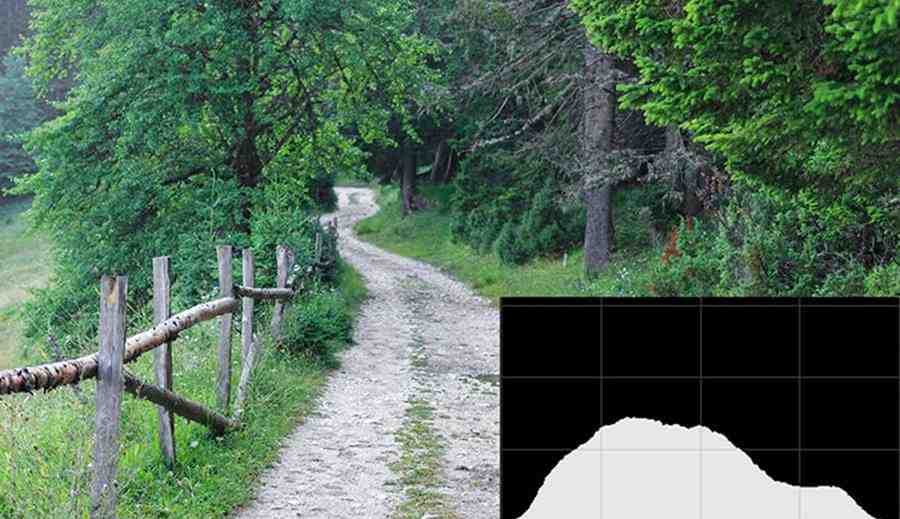
The image histogram does not take into account the artistic features of the image. For example, black tones will prevail in the graph if the subject is photographed with low-key backlighting.
Hence, a perfect histogram of a photograph is not always needed. You shouldn’t strictly follow the rules, as you risk getting a technically ideal shot devoid of aesthetic merits.
When to Use A Histogram?
You should always pay attention to the histogram in photography, but there are many cases when it is beneficial:
1. Shooting At Night
Lack of adequate lighting will prevent you from taking a full, brightly balanced shot. It is where the histogram comes in handy, which will display the actual contrast of light and shadow on your monitor.
2. Shooting Indoors
When working in a studio, you often have to do without a light meter. Therefore, many test shots are taken. The histogram will help you to set the exposure parameters more effectively.
3. During Product Photography
Product photography against a white background can make a photographer’s life much more difficult. The tone plot is necessary to avoid the so-called simultaneous contrast when the eye perceives a color different from what it is. For example, white is often grayed out on a monitor.
How to Control Color with A Histogram?
All this time, it was a question of the histogram of brightness, the ratio of tones, and halftones on the center lines. Now let’s say a few words about what a color histogram is.
Imagine taking a shot. At first, you liked it very much. But when viewing on a PC, you notice that something is wrong with the flowers in the photo: the sunset sky is somehow dull, the foliage is not so green, and indeed the brightness is not enough.
The whole problem is that many factors affect the perception of the picture: lighting, the background on which the image is located, the features of the technique with which the shooting was carried out, etc.
If necessary, you can change the color value of the photo in the photo editor using the curves tool. You will be able to enhance or add tints in the red, green, and blue channels. You can also change the position of the RGB curve here to adjust contrast, light, and shadow intensity.
Image Histogram: Workshop
Let’s look at a concrete example of how you can improve the quality of a photo-based on a tone graph. First, of course, you need to use a photo editor. Next, let’s open the snapshot and look at its histogram.
What can you say about the technical characteristics of this photo? Gray is the area of the same mid-tones that are responsible for contrast, brightness, and detail. The left side is responsible for the shadows, and the right side is for the highlights. The main peak is in the middle of the graph. From this, we can conclude that the photo is in balance. However, the image itself is not very high-contrast; it can be corrected without harming the picture in these conditions.
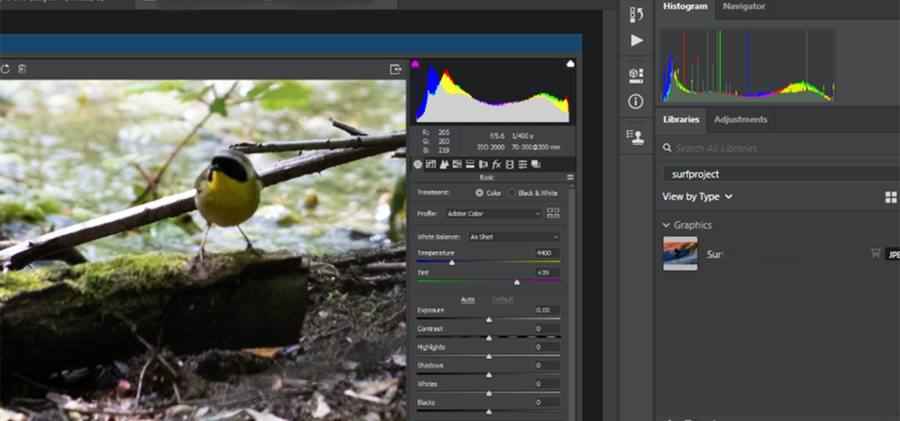
Let’s increase the contrast with Curves. The tool is located in the “Tools” tab. We can bend the line on the graph, giving it an arbitrary shape, affecting certain areas of tones. To increase the contrast, we need to place a control point at the bottom of the curve and lower it slightly.
It will make the black tones richer. And by doing the same procedure with the upper part of the line, we will affect the light areas of the image. Notice how the histogram changes at the top right of the work screen. The gray tones are distributed more or less evenly, and the image has acquired saturation and become more contrast.
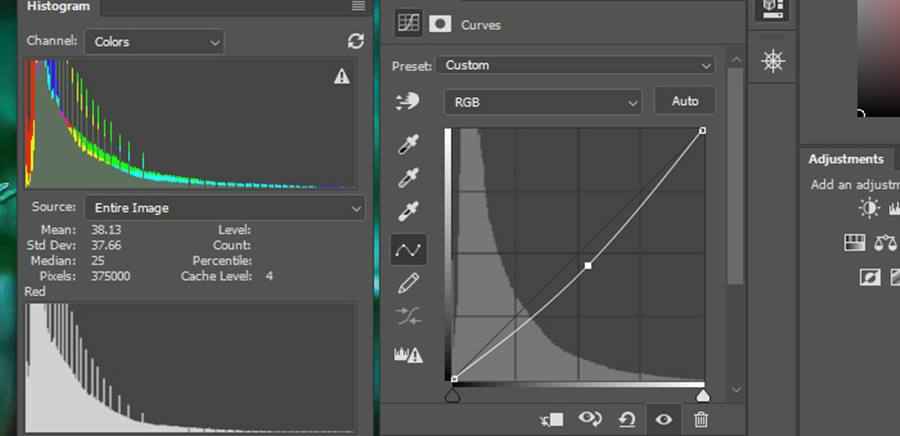
It’s time to pay attention to the color component. The diagram tells us that the reddest is in the highlights, but none is in the shadows. To give the sky the shades of a sunset, paint the shadows in wine shades. In the drop-down menu of the “Channel” section, select the red curve.
As you already understood, the middle part of the line is responsible for the mid-tones, and its changes will affect the whole picture as a whole. And the lower and upper areas are shadows and highlights.
Accordingly, to blend red into the dark places of the image, we must use the black point. Lift it and see the result. The frame looks much more interesting. You can experiment with the shape of the curves in the other channels: blue and green, for the most visually pleasing and exciting processing result.
Conclusion
Understanding what a histogram is is essential for improving the shooting process, subsequent editing, and improving the technical level of your knowledge. However, the histogram graph only provides background information about the image and does not consider the frame’s innovative features. Do not forget that sometimes only the creative genius of the photographer can distinguish a defective photo from a masterpiece.


